Collecting Data from Nature
A great way for children to learn about statistics is for them to collect data from the world around them. Click on the sections below to see some examples and ideas of how children could collect data from nature.
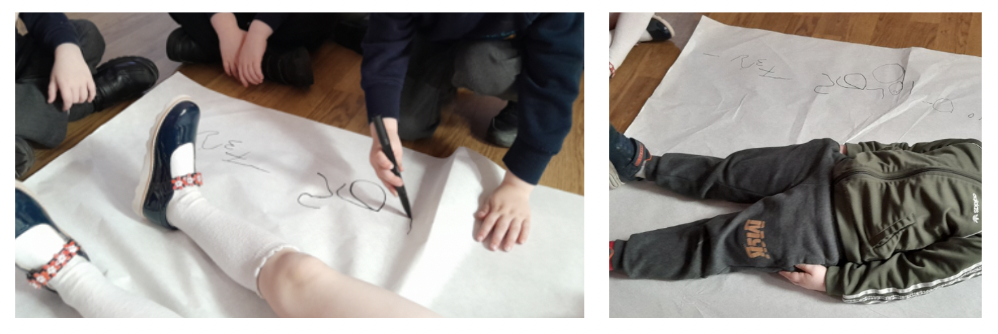
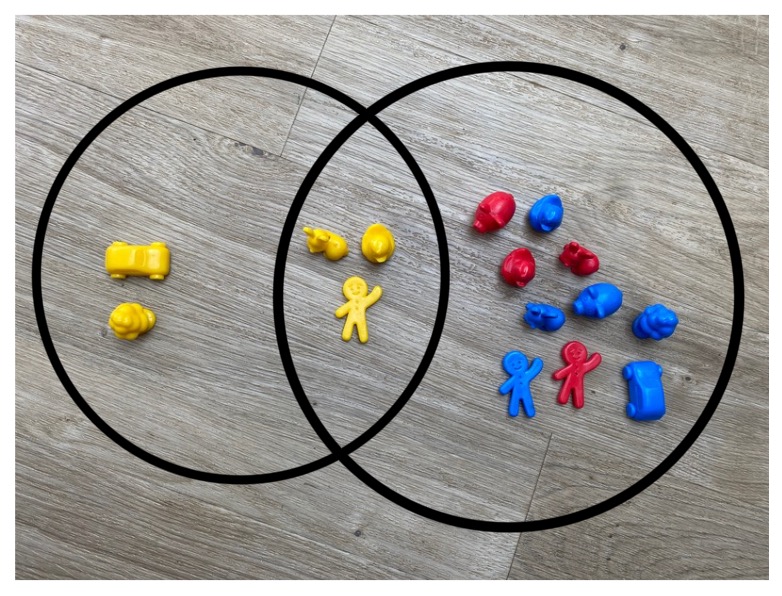
Sorting Leaves
Leaves
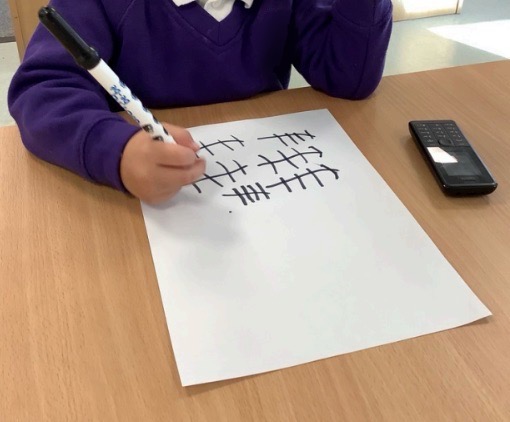
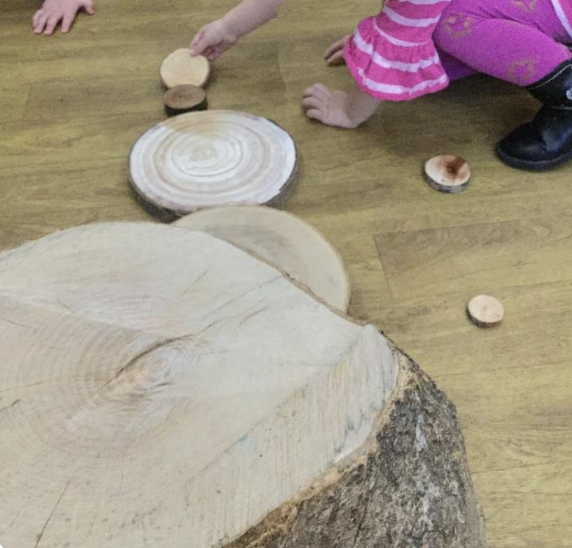
One child decided to sort a collection of leaves by colour. This is a great example of grouping qualitative data (you can read about the different types of data in our article “types of data”). If they wanted to, the child could then record the number of leaves of each colour using a tally and then display this data using a bar chart.

| Leaf Colour | Tally | Frequency |
|---|---|---|
| Green | \(\cancel{////}\cancel{////}\cancel{////}\cancel{////}\cancel{////}\cancel{////}\cancel{////}///\) | 38 |
| Yellow | \(////\) | 4 |
| Orange | \(\cancel{////}//\) | 7 |
| Red | \(//\) | 2 |

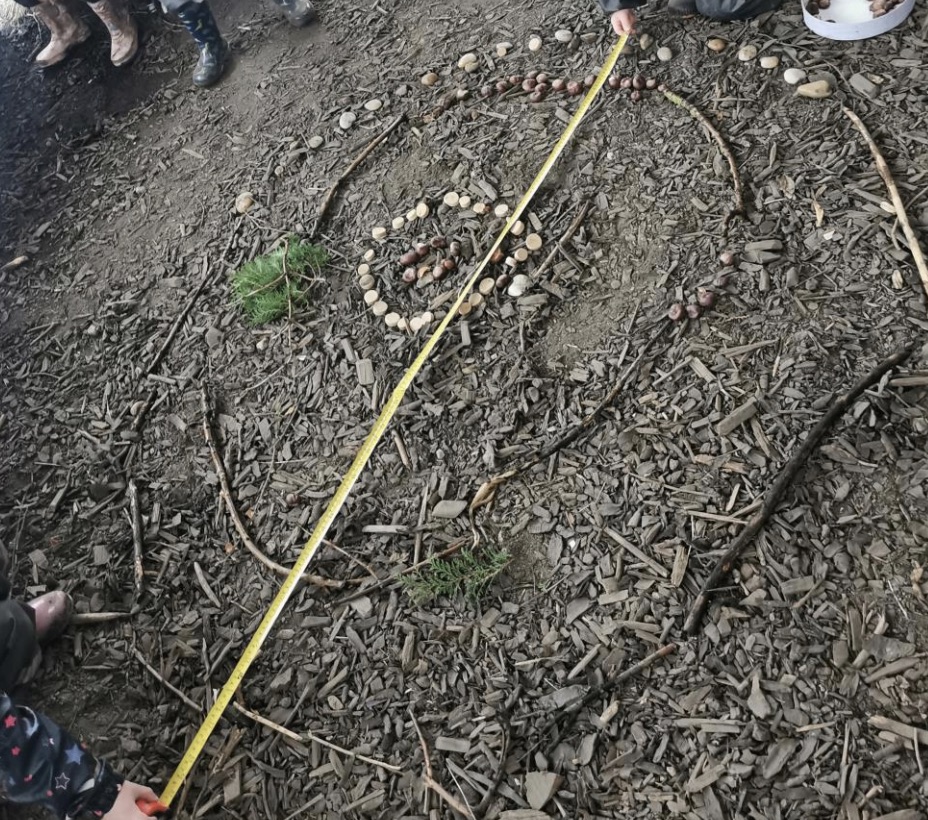
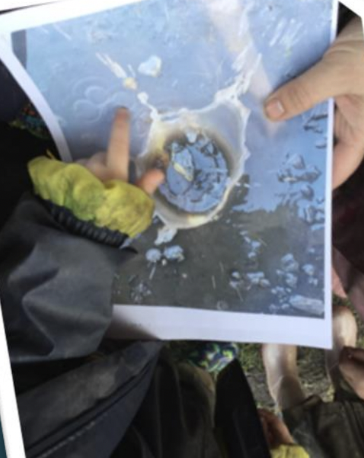
Collecting Rain
Collecting Rain
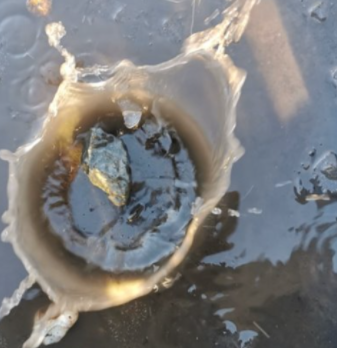
At one nursery, a child was very interested in the rain and decided to collect some rainwater. To do this, they placed a bucket in the rain and left it for some time. Other children then became interested and added more containers. The child was happy to see how much water their bucket had collected and asked to leave it outside overnight, as they knew it would collect more water.

To continue their exploration, the children could measure the amount of water collected each day over a few weeks. They could then record this data in a few different ways. Some ideas that children may find interesting include using a line graph and using a histogram. Examples of both of these graphs are shown below using some pretend data.
Click here to see the data
Pretend Rainfall Data:
| Day | Amount of Rainfall |
|---|---|
| 1 | 2mm |
| 2 | 10mm |
| 3 | 0mm |
| 4 | 0mm |
| 5 | 3mm |
| 6 | 12mm |
| 7 | 8mm |
| 8 | 6mm |
| 9 | 4mm |
| 10 | 0mm |
| 11 | 0mm |
| 12 | 0mm |
| 13 | 7mm |
| 14 | 15mm |
| 15 | 12mm |
| 16 | 0mm |
| 17 | 0mm |
| 18 | 5mm |
| 19 | 5mm |
| 20 | 2mm |
Using a Line Graph
The children could use a line graph as described in our article on types of graphs to visualise the pattern of rainfall over several days. An example of this graph using the pretend data is given below; the children may enjoy seeing the peaks where there were clusters of rainy days.

Using a Histogram
The children could also use a histogram as described in our article on types of graphs to visualise how many days had rainfall between 0mm and 3mm, compared to the number of days that had rainfall between 3mm and 6mm and so on. An example of this graph using the pretend data is given below.