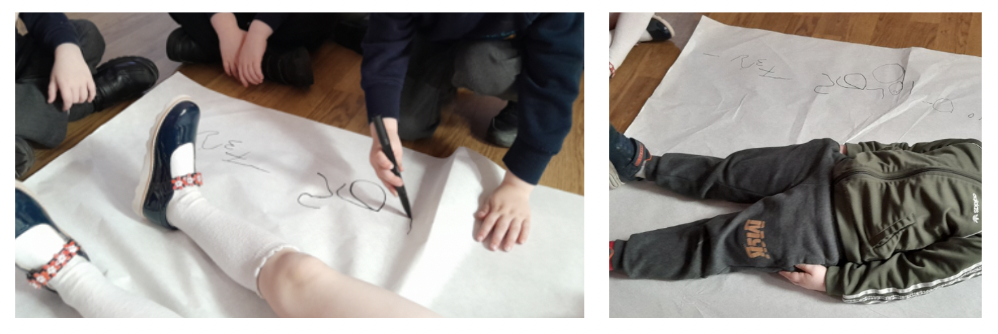
Collecting Data using Toys
Children might enjoy gathering data when playing with different toys around the classroom. Click on the sections below to see some examples and ideas of how children could collect data using toys.
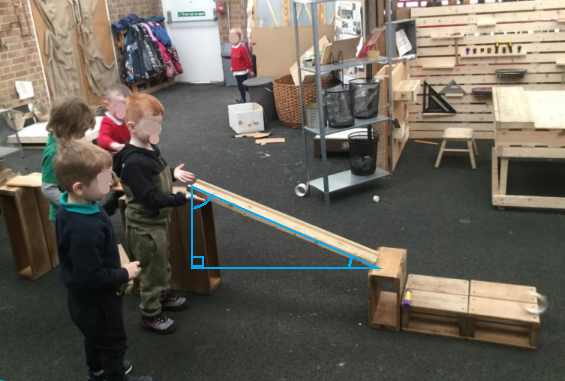
Ramp Height and Speed
Varying the height of ramps to change the speed of a car
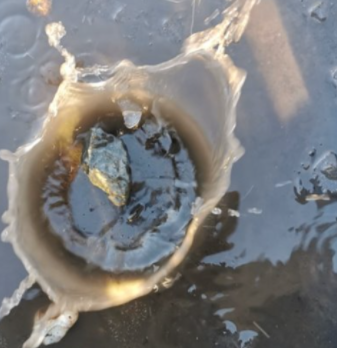
At one nursery, a child spent time varying the height of a ramp to see how it affected the speed of a toy car. They spent time changing the angle of the ramp and predicting how fast the car would move.
Child: “This is just a little one, the car hasn’t gone really fast, just a little bit fast.”
Teacher: What did you discover when the angle of the ramp was made smaller?
Child: “It’s gone faster now, that’s because I moved it, I moved it up.”
Here, the angle that was made smaller was the angle between the top of the ramp and the vertical side of the supporting box.

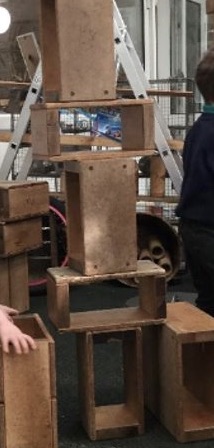
Child: “The black one is long, I can stand it up, I will put more bricks up high like a tower.”
Child: When it goes really really fast it crashes at the bottom.”
The child could rank or record the car speeds and angles. Then they could plot these on a graph to find that the smaller the angle (of the top of the ramp with the vertical), the faster the car moves down the ramp. To read more about recording data when playing with ramps see our Ramp Play booklet.
Properties of Toys
Properties of Toys
Children could spend some time categorising different toys and arranging them into groups. They could draw circles around these groups to make a Venn diagram. In the image below, the toys have been sorted into the categories yellow and animals and people, the middle group is the intersection of both.