Dice
Dice are a great tool for learning about probability and distributions. Here are a few ideas of activities children could try.
Investigating Fair and Unfair Dice
To test if a die is fair, we can roll it multiple times and record how many times each number is rolled in a bar chart. For a fair die and a large number of rolls, the bars should be approximately equal. In the graph below, we have simulated rolling a fair die 10,000 times and counted the number of times each value was rolled. Below the graph is a table giving the probability of rolling each number using the fair die.

| Number on Die | Probability of Being Rolled |
|---|---|
| 1 | \(\frac{1}{6}\) |
| 2 | \(\frac{1}{6}\) |
| 3 | \(\frac{1}{6}\) |
| 4 | \(\frac{1}{6}\) |
| 5 | \(\frac{1}{6}\) |
| 6 | \(\frac{1}{6}\) |
| Sum | 1 |
You can buy biased dice, which tend to land on a certain number more than others. The graph below is an example of the number of times each number was rolled by a biased die when we rolled it 10,000 times. Below the graph is a table giving the probability of rolling each number using the biased die.

| Number on Die | Probability of Being Rolled |
|---|---|
| 1 | \(\frac{1}{12}\) |
| 2 | \(\frac{1}{12}\) |
| 3 | \(\frac{1}{12}\) |
| 4 | \(\frac{1}{12}\) |
| 5 | \(\frac{1}{12}\) |
| 6 | \(\frac{7}{12}\) |
| Sum | 1 |
Rolling Two Dice
We can also see what happens when we roll multiple dice at the same time and add the values we get. In the graph below is an example of this for 2 dice (we have rolled both dice 10,000 times). Here we can see that the columns are not equal, as there are multiple ways of making some numbers and only one way of making others.

Click here to see the number of combinations and probability of getting each possible sum
In the table below, we can see the number of different ways of making each number from a sum of two dice. We can see that the tallest column in the bar chart is for a sum of 7. In the table, we can see that the number 7 has the highest number of ways to be made from a combination of two dice. As both dice are fair, this means that a sum of 7 has the highest probability of being rolled.
| Sum of Dice | Number of Combinations | Probability |
|---|---|---|
| 2 | 1 | \(\frac{1}{36}\) |
| 3 | 2 | \(\frac{2}{36}\) |
| 4 | 3 | \(\frac{3}{36}\) |
| 5 | 4 | \(\frac{4}{36}\) |
| 6 | 5 | \(\frac{5}{36}\) |
| 7 | 6 | \(\frac{6}{36}\) |
| 8 | 5 | \(\frac{5}{36}\) |
| 9 | 4 | \(\frac{4}{36}\) |
| 10 | 3 | \(\frac{3}{36}\) |
| 11 | 2 | \(\frac{2}{36}\) |
| 12 | 1 | \(\frac{1}{36}\) |
| Sum | 36 | 1 |
Click here to read more about the probability of rolling a given sum
There are 5 ways to get the sum of 6, and these are summarised in the table below. You may think that the case of the first dice being 1 and the second being 5 is the same as the first dice being 5 and the second dice being 1. For the sake of finding the sum of the dice, this is true; however, we have to notice that the case of rolling one of the dice to be a 1 and one of the dice to be a 5 occurs twice as much as the case where both dice are 3.
Each die has the probability \(\frac{1}{6}\) of giving each number this means that the case of the first dice being 1 and the second dice being 5 occurs with a probability of \(\frac{1}{36}\) and the case of the first dice being 5 and the second dice being 1 occurs with a probability of \(\frac{1}{36}\). This makes the total probability of rolling one 1 and one 5 \(\frac{2}{36}\) which is twice as much as the probability of rolling two 3’s, which is \(\frac{1}{36}\).
Adding the probabilities in the table gives us the total probability of rolling two dice that sum to six to be \(\frac{5}{36}\). The total number of ways that the two dice can be rolled is 36, as there are 6 possibilities for the first dice and 6 possibilities for the second dice and \(6\times 6= 36\). This means that the probability of rolling a six from two dice \(\frac{5}{36}\) corresponds to saying that 5 out of the 36 dice combinations lead to a combined sum of 6 as the two dice are fair.
| Dice 1 | Dice 2 | Probability of Happening |
|---|---|---|
| 1 | 5 | \(\frac{1}{36}\) |
| 2 | 4 | \(\frac{1}{36}\) |
| 3 | 3 | \(\frac{1}{36}\) |
| 4 | 2 | \(\frac{1}{36}\) |
| 5 | 1 | \(\frac{1}{36}\) |
Rolling More Than 2 Dice
If we use more dice, the shape of the graph approaches a bell curve. This is a common shape in statistics and is caused by the central limit theorem. Here, this means that as the number of rolls becomes very large, the distribution for the sum of a large number of fair dice starts to have a bell curve shape. This shape in statistics corresponds to a normal distribution. In the graph below, we have rolled and summed 6 fair dice 10,000 times.

Another example of a bell curve could come from comparing the height of a large group of people. The children in the nursery could try this if the class size was big enough.
Rolling 2 Biased Dice
If we were to roll two biased dice with the probabilities as given in the table below, we would get the graph shown in the image below, where we can see the results are skewed to favour higher sums.
| Number on Die | Probability of Being Rolled |
|---|---|
| 1 | \(\frac{1}{12}\) |
| 2 | \(\frac{1}{12}\) |
| 3 | \(\frac{1}{12}\) |
| 4 | \(\frac{1}{12}\) |
| 5 | \(\frac{1}{12}\) |
| 6 | \(\frac{7}{12}\) |
| Sum | 1 |

Click here to see the number of combinations and probability for getting each possible sum
| Sum of Dice | Number of Combinations | Probability |
|---|---|---|
| 2 | 1 | \(\frac{1}{144}\) |
| 3 | 2 | \(\frac{2}{144}\) |
| 4 | 3 | \(\frac{3}{144}\) |
| 5 | 4 | \(\frac{4}{144}\) |
| 6 | 5 | \(\frac{5}{144}\) |
| 7 | 6 | \(\frac{18}{144}\) |
| 8 | 5 | \(\frac{17}{144}\) |
| 9 | 4 | \(\frac{16}{144}\) |
| 10 | 3 | \(\frac{15}{144}\) |
| 11 | 2 | \(\frac{14}{144}\) |
| 12 | 1 | \(\frac{49}{144}\) |
| Sum | 36 | 1 |
In the Classroom
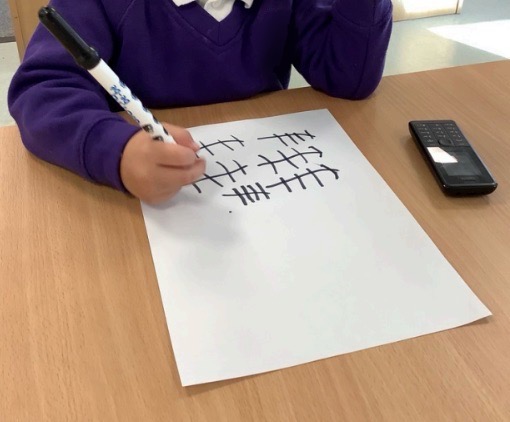
In the classroom, children can experiment with rolling a die and counting the number of times each value appears, to see if they think the die is fair or not. The graphs below are 6 experiments of 20 rolls on the same die; in this case, the die was simulated to be fair. These could be the results we would get if 6 children tested the same die with 20 rolls each.

Some of these graphs might make us think that the die is not fair, for example, in the bottom right graph, the die seems to be biased toward the number 4. A big part of statistics is determining how unlikely a result is, for instance, how likely are we to get the results in the bottom right graph if the die really is fair. Whilst this can involve some more complex maths (called hypothesis testing), the message behind it is that statisticians have to be aware that we can get unlikely results, such as the die appearing biased even when the die is fair. Performing more rolls of the die can make the behaviour of the die more obvious, so the children could discuss how many rolls they think are needed and how likely they think their results are if the die is fair.