Children Collecting Data about Themselves
Children can find statistics particularly engaging when they use graphs to learn about themselves. Click on the sections below to see some examples and ideas of how children could collect data about themselves.
Comparing Heights
Children Comparing Their Heights
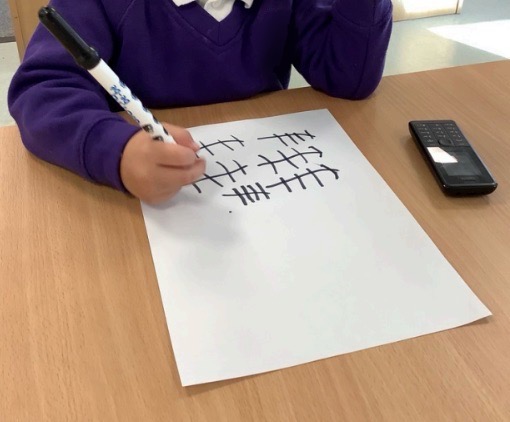
In one nursery, the children were interested in comparing their heights. They decided to lie on the same piece of paper, one at a time, and compare their heights to a scale of numbers they had written on the paper.
Child: “I know, I have grown so tall over Easter, we should find out how tall I am. I can lie down on paper and then the children can write numbers next to me and then we can see how tall I am.”

First, one child lay on the big sheet of paper, and the other children wrote the numbers 1 to 15 next to the child. The children then wrote the child’s name next to the number they reached on the paper. Each child then took their turn lying down and writing their name next to the number they reached. Using this method, the children were able to find the tallest child in the class. Whilst height is normally a continuous measurement, the children have used a discrete system here, so they could plot a bar chart of the children’s heights and find out the distribution of the heights in the class. To read about the different types of data, such as discrete and continuous, see our article types of data.
If the children had used a continuous measuring system, for example, using centimetres, they could present these measurements in a histogram to visualise the different heights in the class. An example of this is shown below using a pretend dataset.
Click here to see the data
Data of a pretend sample of students:
| Child | Height (cm) |
|---|---|
| 1 | 106.3 |
| 2 | 99.1 |
| 3 | 106.7 |
| 4 | 109.5 |
| 5 | 95.8 |
| 6 | 104.4 |
| 7 | 108.9 |
| 8 | 109.3 |
| 9 | 99.4 |
| 10 | 102.2 |
| 11 | 105.5 |
| 12 | 106.9 |
| 13 | 109.5 |
| 14 | 100.7 |
| 15 | 95.1 |
| 16 | 104.4 |
| 17 | 105.3 |
| 18 | 95.9 |
| 19 | 109.9 |
| 20 | 94.2 |

Comparing Favourite Animals
Children Comparing Their Favourite Animals
The children could collect some data about their interests or preferences. One idea could be for them to all write down their favourite animal and produce graphs to see what trends there are in the class. It might be a good idea to let the children choose from a limited selection of animals so that there aren’t too many categories. Some pretend data is shown below, along with some plots that the children could make and discuss. These examples and more are discussed in more detail in our article on types of graphs.
Click here to see the data
Data of a pretend sample of students:
| Child | Favorite Animal |
|---|---|
| 1 | dog |
| 2 | cat |
| 3 | hamster |
| 4 | dog |
| 5 | cat |
| 6 | dog |
| 7 | dog |
| 8 | cat |
| 9 | hamster |
| 10 | dog |
| 11 | cat |
| 12 | dog |
| 13 | hamster |
| 14 | cat |
| 15 | dog |
| 16 | hamster |
| 17 | dog |
| 18 | cat |
| 19 | dog |
| 20 | dog |
The children could use a pie chart, a bar chart or a pictograph to visualise how popular each type of animal was in the class. Examples of these are shown below.